Normalizing count matrix...Done!
Predicting COO...Model not specified. Using the 21-gene GOYA model...
Predicting DZsig...Model not specified. Using the 29-gene GAMBL model...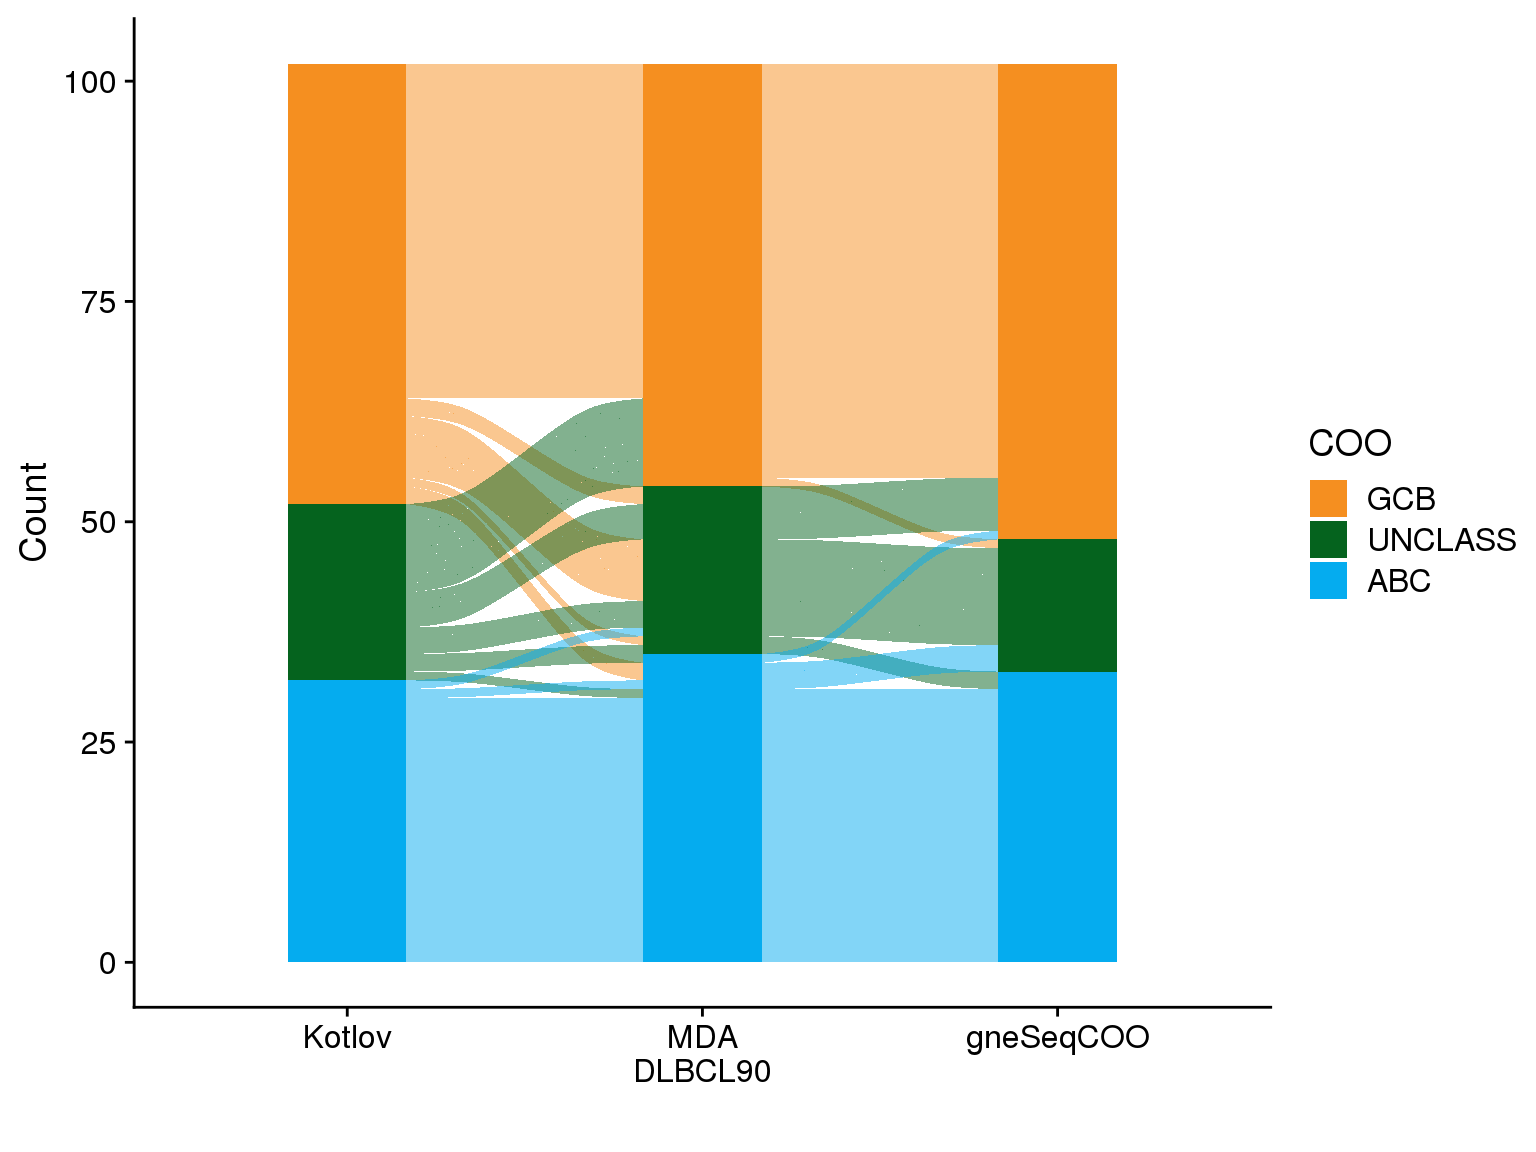
Done!Comparison of genetic and gene expression classifications in data generated by BostonGene and MD Anderson
Background
This is an experiment to test and compare the performance of the gneSeqCOO model on RNAseq to that of NanoString. It will also evaluate our new gneSeqDZsig model. All of the comparisons will be performed in the validation cohort.
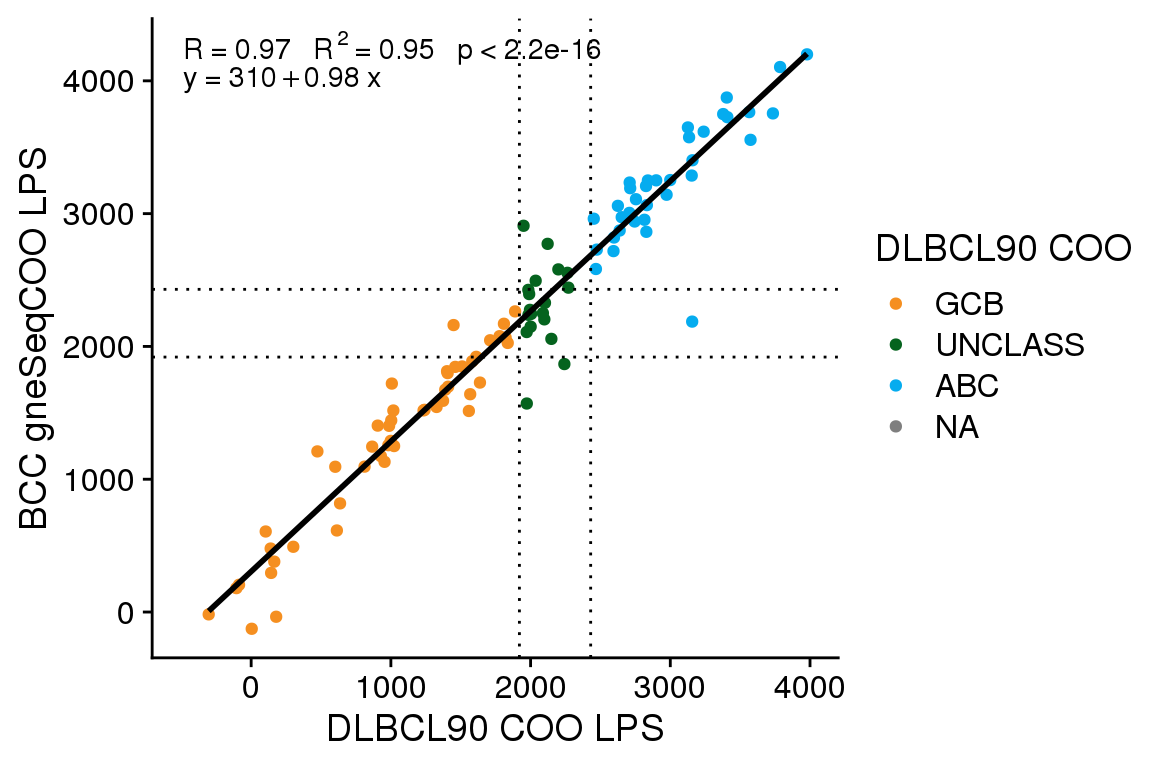
gneSeqCOO vs DLBCL90 COO
         BG
BCC       GCB UNCLASS ABC
  GCB      38       3   0
  UNCLASS   5      18   2
  ABC       0       2  40
gneSeqCOO_BCC
NanoString GCB UNCLASS ABC
GCB 40 8 0
UNCLASS 2 11 6
ABC 0 1 34 gneSeqCOO_BG
NanoString GCB UNCLASS ABC
GCB 39 7 1
UNCLASS 2 13 4
ABC 0 0 35 BGTP
NanoString GCB UNCLASS ABC
GCB 48 10 0
UNCLASS 10 9 1
ABC 2 2 33 BCC
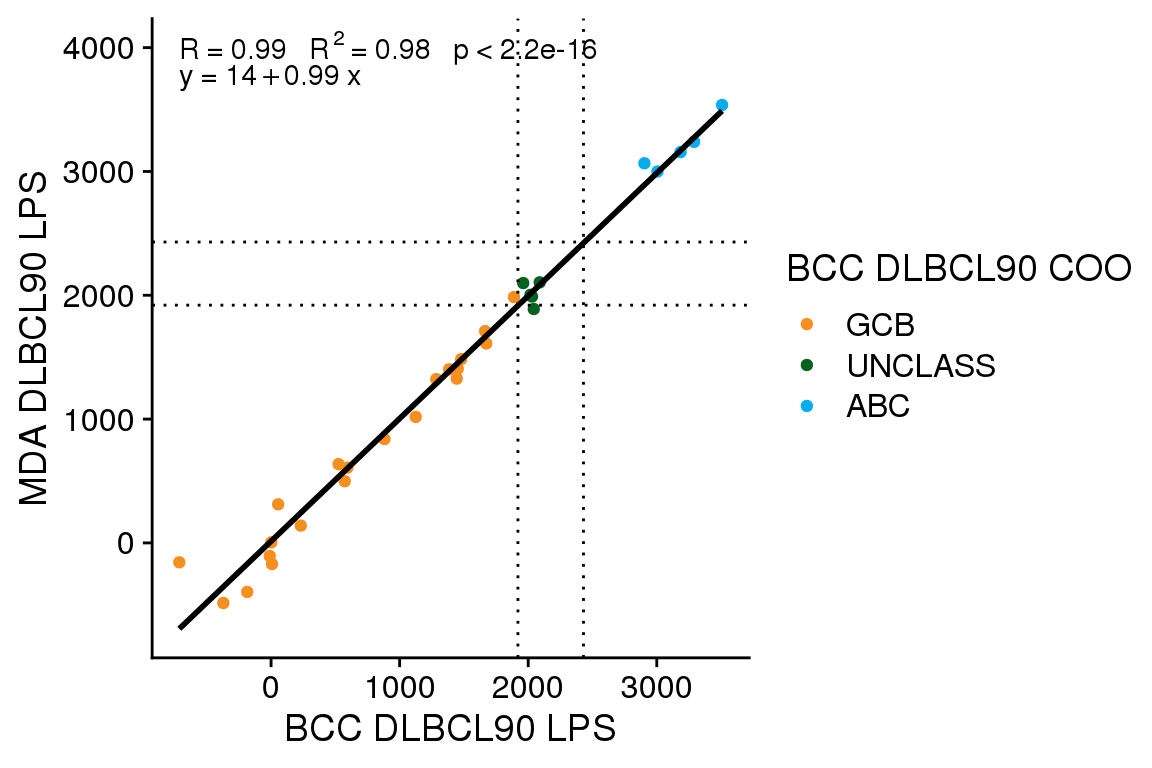
MDA GCB UNCLASS ABC
GCB 20 1 0
UNCLASS 1 4 0
ABC 0 0 5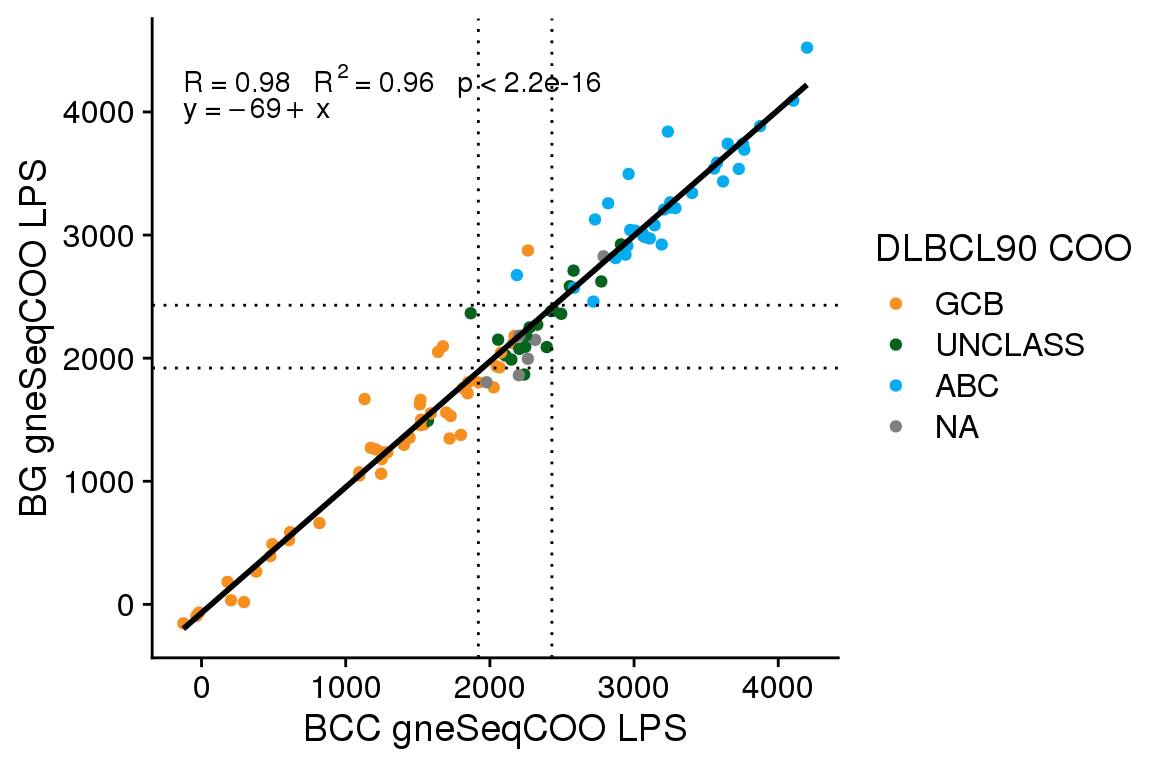
Score correction
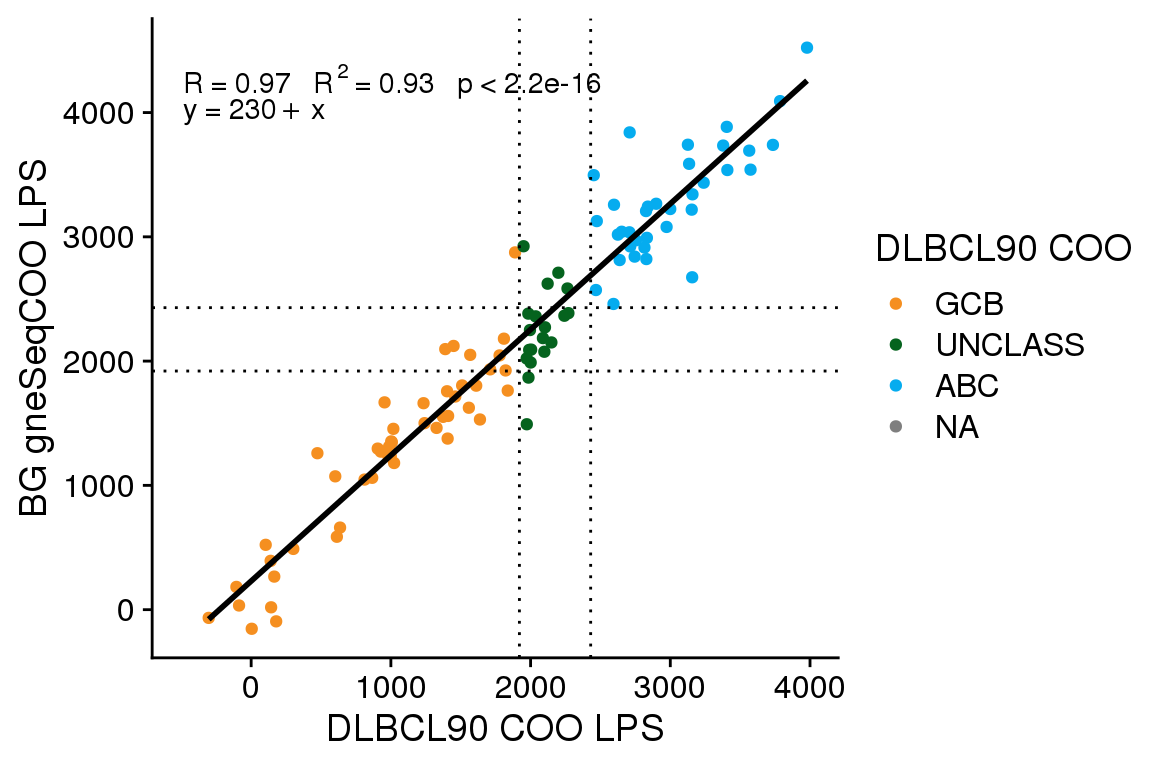
The gneSeqCOO LPS scores generated at BCC have a line of best fit with an intercept of 310 and a slope of 0.98. This is similar to the score shift observed for FFPE Ribodepletion samples from GAMBL, whereas fresh frozen samples have a smaller score shift (intercept of ~170-190). Here I will apply the same score shift correction determined from GAMBL (300) to see if this adequately corrects the score shift.
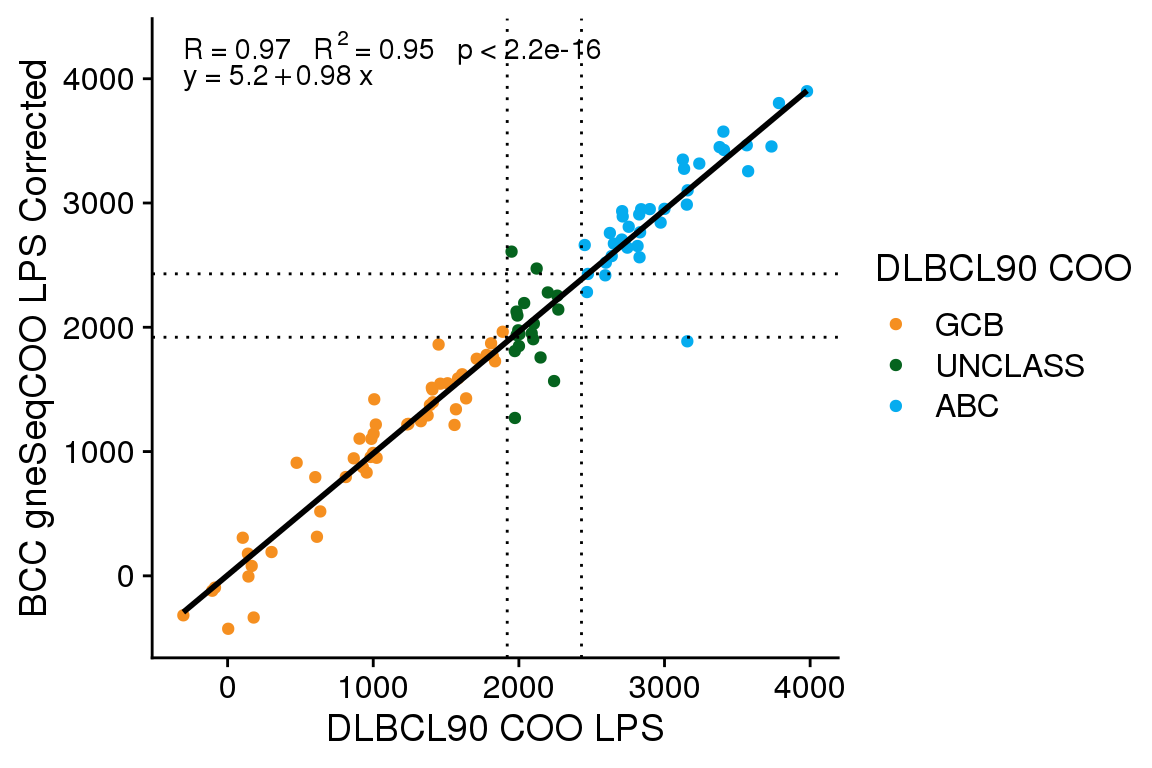
The accuracy of gneSeqCOO as run by BostonGene is 0.86 (95% CI 0.78 - 0.92), and as run by BCC (with score correction) is 0.87 (95% CI 0.79 - 0.93). Comparing the gneSeqCOO results generated at BCC vs BG, the accuracy is 0.81 (95% CI 0.72 - 0.88). A McNemar’s test comparing whether the corrected gneSeqCOO scores from BCC are more accurate than the uncorrected scores shows no significant difference (P = 0.4795001). Therefore, while the score correction does align the scores better, it does not significantly alter the classification accuracy.
| misclassified | n | percent |
|---|---|---|
| FALSE | 78 | 98.734177 |
| TRUE | 1 | 1.265823 |
The frank misclassification rate (switching from ABC to GCB) is 1/75 (1.3%) when comparing gneSeqCOO (BG) to NanoString, or 0% when comparing gneSeqCOO (BCC) to NanoString or gneSeqCOO results run at BG vs at BCC.
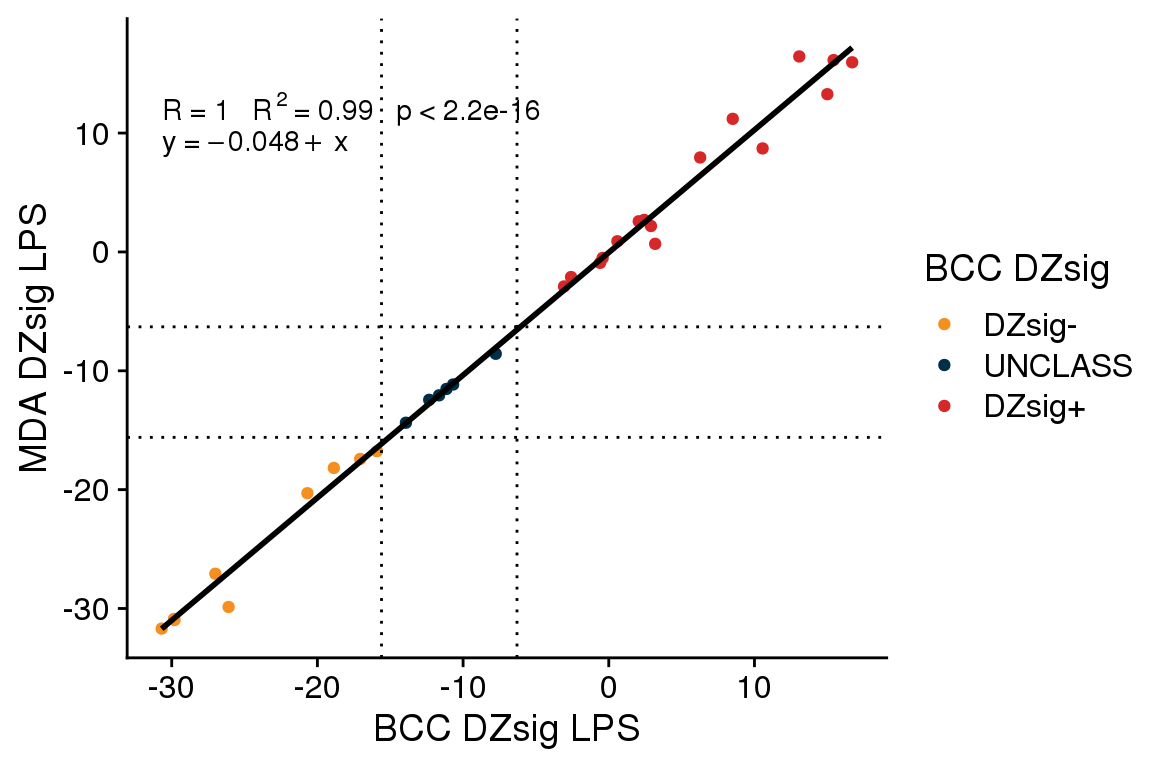
gneSeqDZsig vs DLBCL90 DZsig
          gneSeqCOO_BCC
NanoString DZsig- UNCLASS DZsig+
   DZsig-      43       0      0
   UNCLASS      0      18      0
   DZsig+       0       0     23
BCC DLBCL90 DZsig
MDA DLBCL90 DZsig DZsig- UNCLASS DZsig+
DZsig- 81 0 0
UNCLASS 0 21 0
DZsig+ 0 0 23| MDA_DZsig | DH_BCL2 | n |
|---|---|---|
| DZsig- | FALSE | 27 |
| UNCLASS | FALSE | 14 |
| UNCLASS | TRUE | 2 |
| DZsig+ | FALSE | 7 |
| DZsig+ | TRUE | 15 |
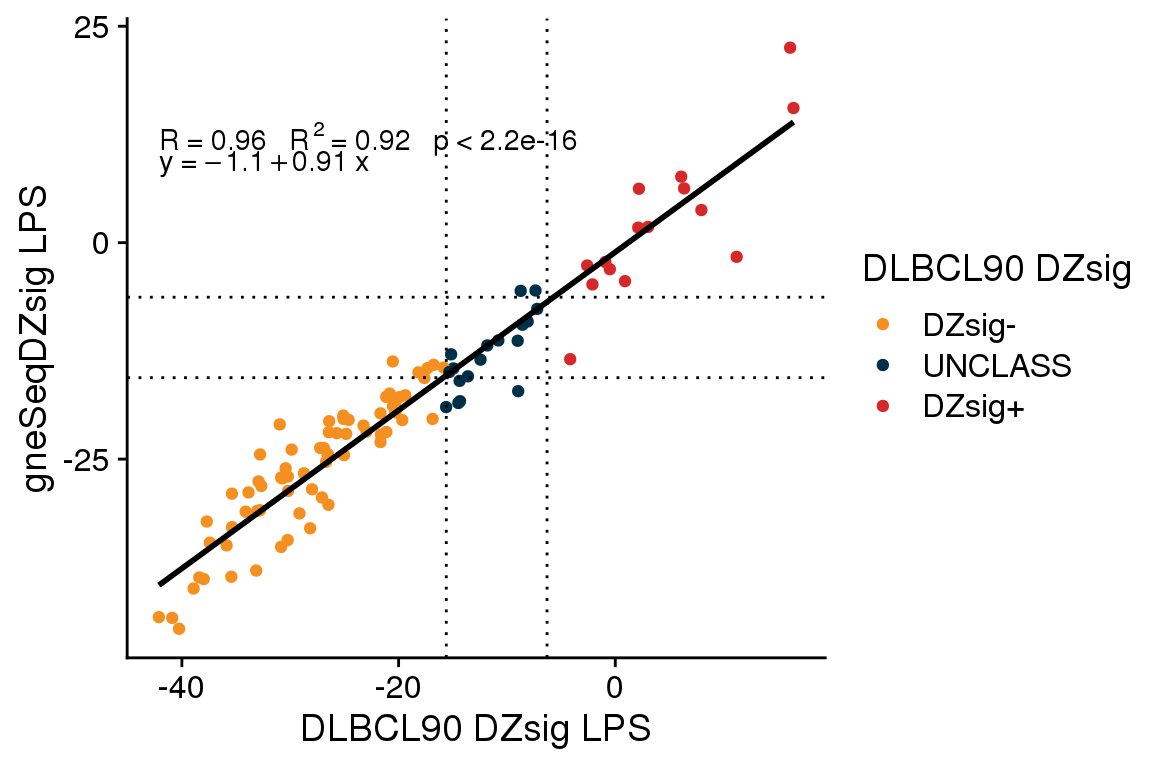
The accuracy of gneSeqDZsig among validation cohort tumors classified as ABC or UNCLASS by the DLBCL90 COO assay is 1 (95% CI 0.96 - 1). There were no frank misclassifications (i.e. switching from DZsig+ to DZsig- or vice versa) when comparing the gneSeqDZsig results to the NanoString results.
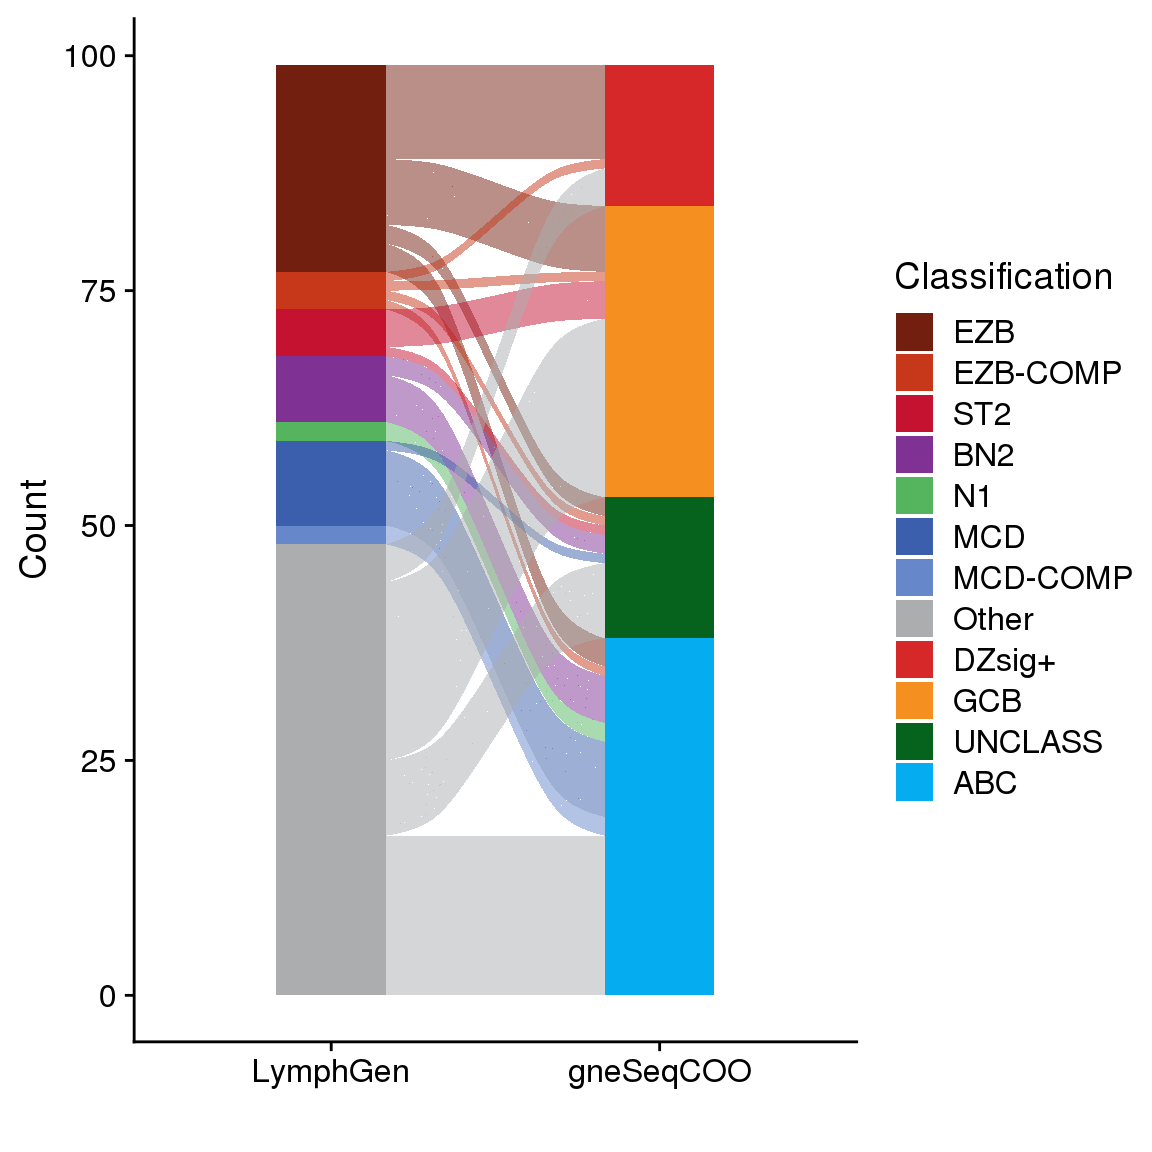
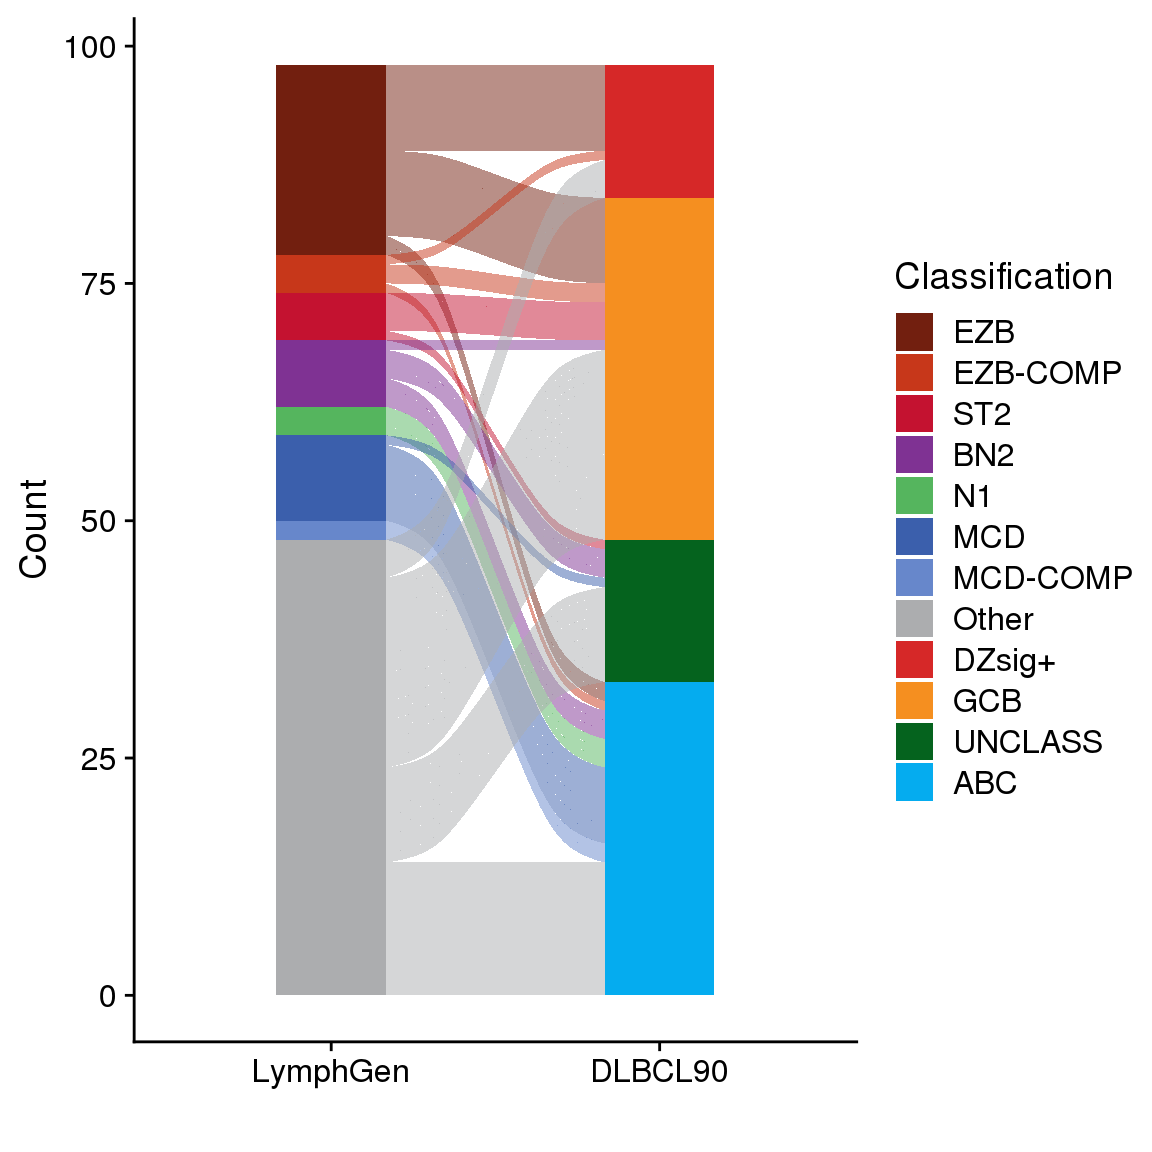
LymphGen vs COO