Differential Gene Expression
Bruno Grande
2017-03-02
Differential Gene Expression
design(salmon$clean$dds) <- deseq_design
salmon$clean$dds         <- DESeq(salmon$clean$dds, minReplicatesForReplace = 5)
Tumour vs. Normal
H0: LFC = 0
salmon$clean$de          <- list()
salmon$clean$de$ts       <- list()
salmon$clean$de$ts$lfc_0 <- results(
  salmon$clean$dds,
  contrast = list(c("clinical_variantSporadic", "clinical_variantEndemic"),
                  c("clinical_variantCentroblast")))

summary(salmon$clean$de$ts$lfc_0)
out of 36655 with nonzero total read count
adjusted p-value < 0.1
LFC > 0 (up)     : 10858, 30%
LFC < 0 (down)   : 9321, 25%
outliers [1]     : 0, 0%
low counts [2]   : 0, 0%
(mean count < 1)
[1] see 'cooksCutoff' argument of ?results
[2] see 'independentFiltering' argument of ?resultsplotMA(salmon$clean$de$ts$lfc_0, ylim = c(-5, 5))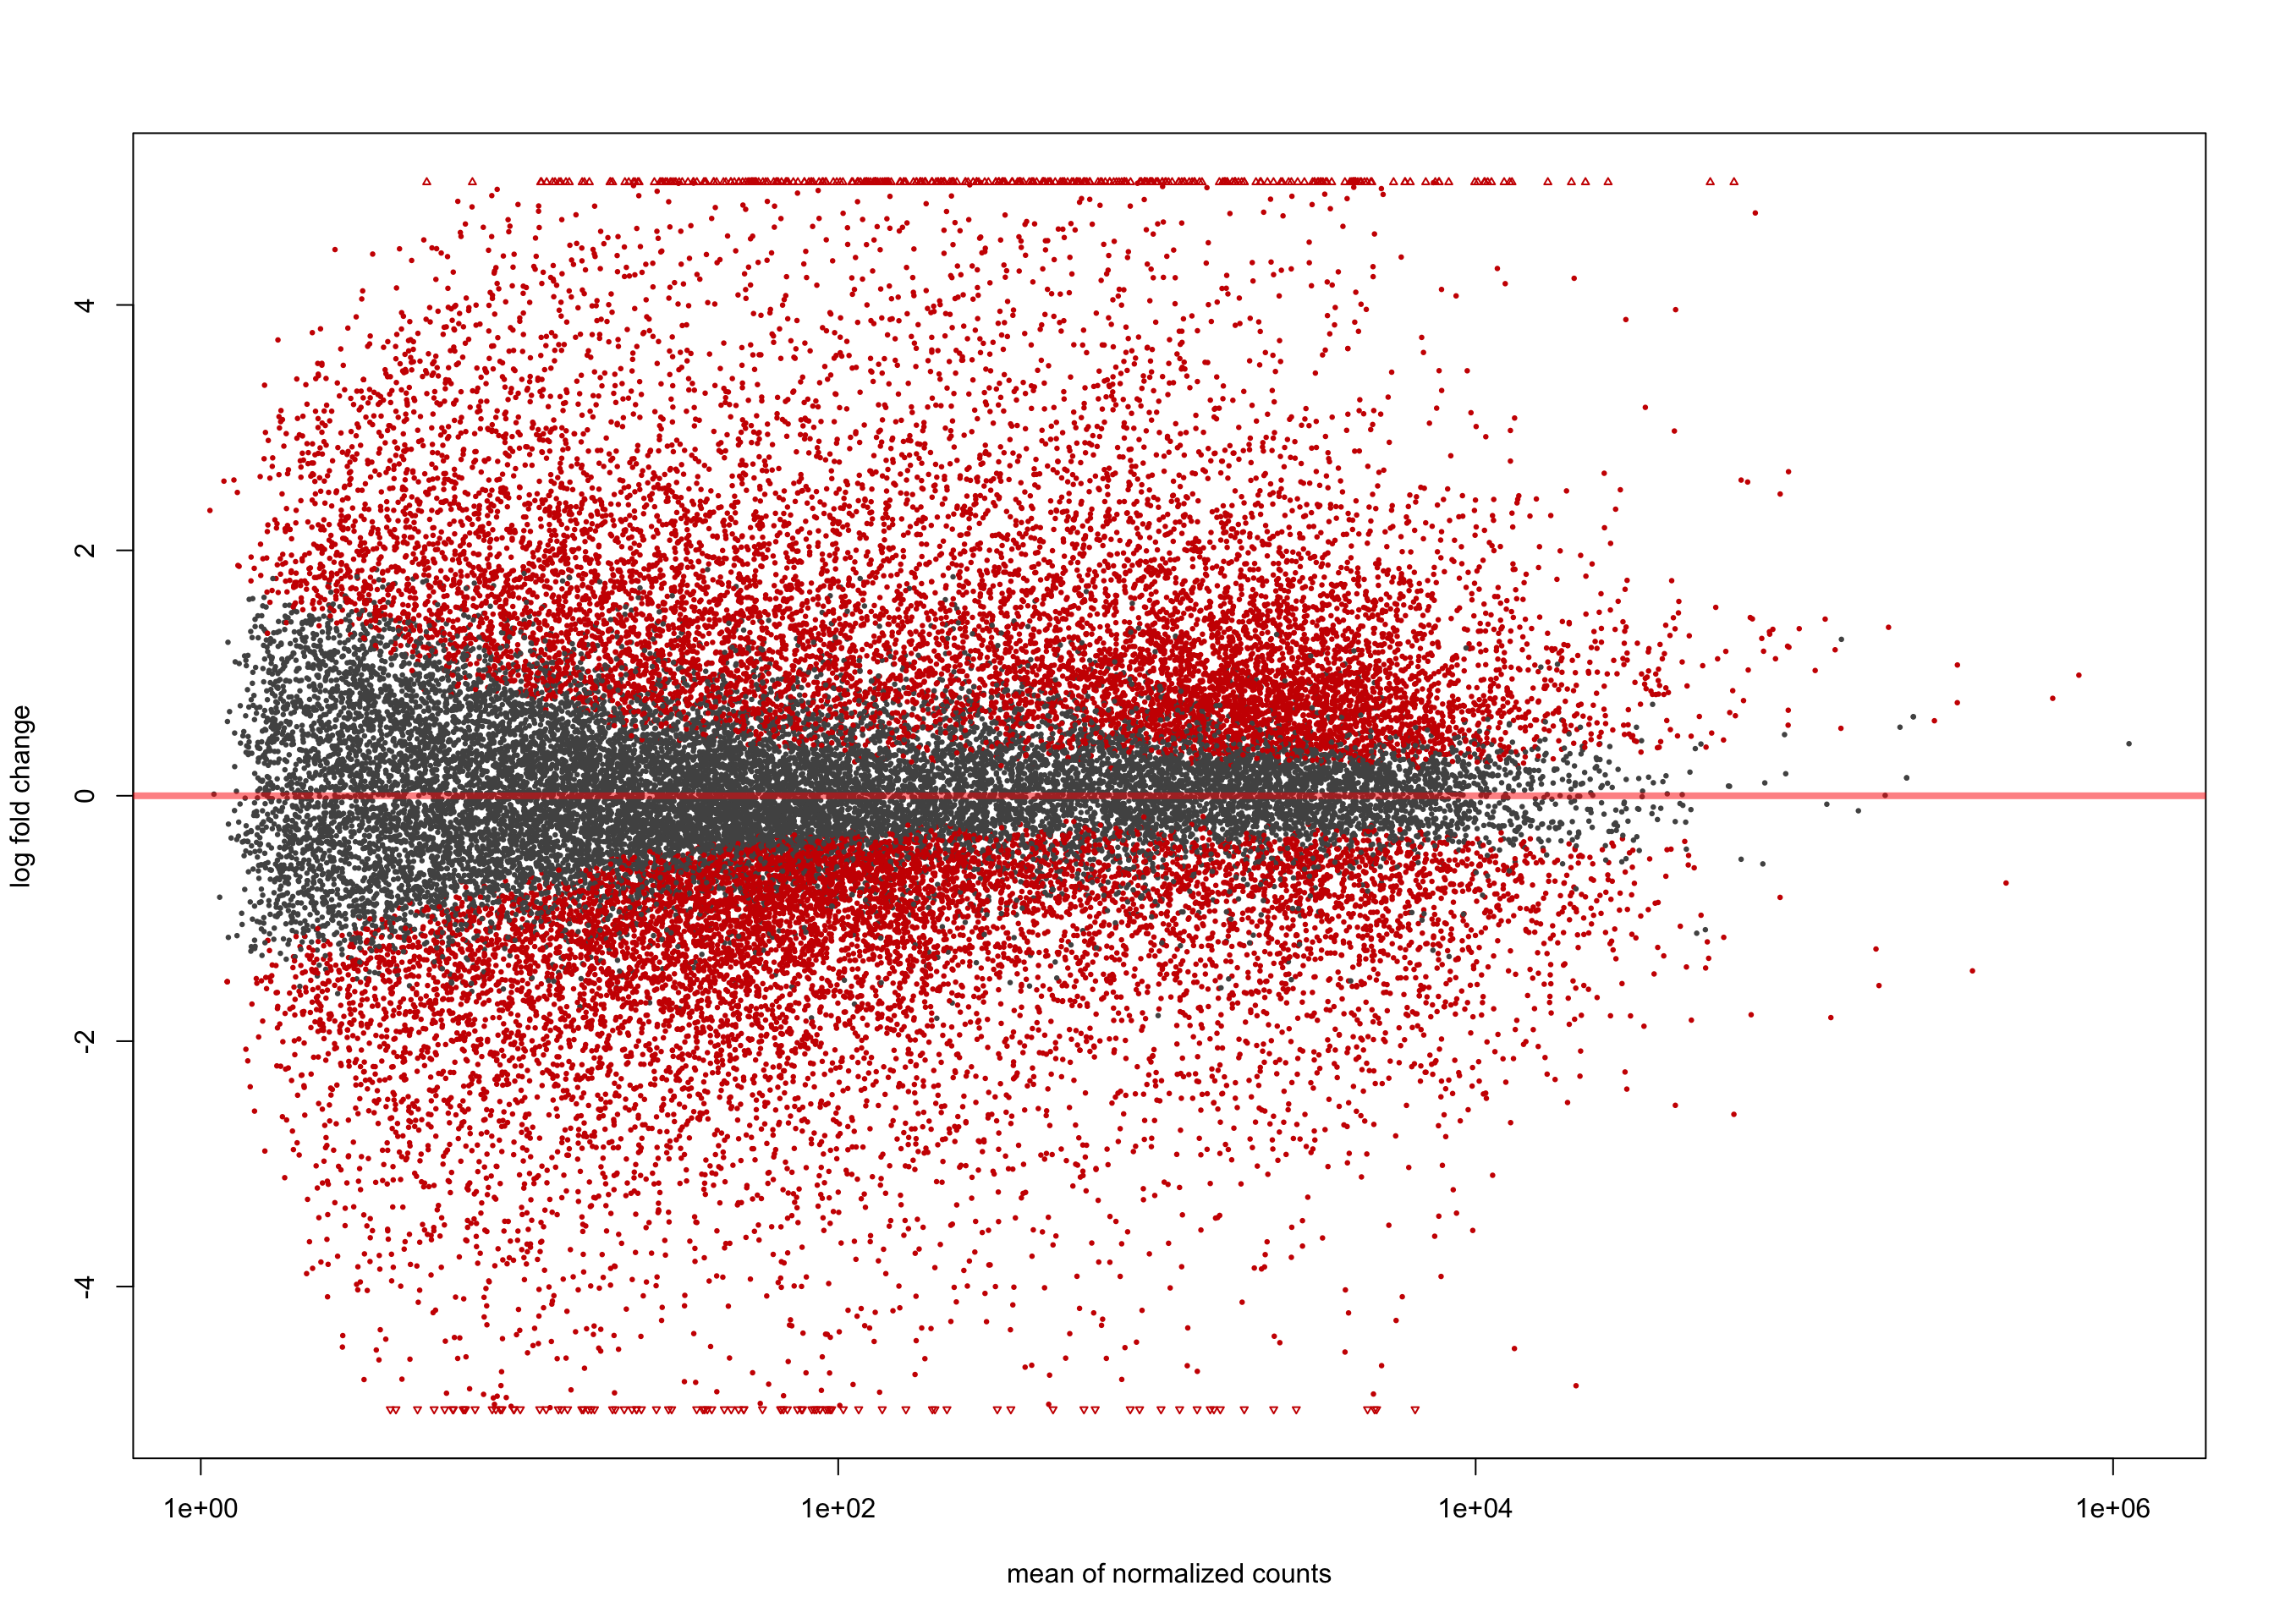
H0: |LFC| > 1.5
salmon$clean$de$ts$lfc_1.5 <- results(
  salmon$clean$dds,
  contrast = list(c("clinical_variantSporadic", "clinical_variantEndemic"),
                  c("clinical_variantCentroblast")),
  lfcThreshold = 1.5)

summary(salmon$clean$de$ts$lfc_1.5)
out of 36655 with nonzero total read count
adjusted p-value < 0.1
LFC > 0 (up)     : 1383, 3.8%
LFC < 0 (down)   : 846, 2.3%
outliers [1]     : 0, 0%
low counts [2]   : 1422, 3.9%
(mean count < 3)
[1] see 'cooksCutoff' argument of ?results
[2] see 'independentFiltering' argument of ?resultsplotMA(salmon$clean$de$ts$lfc_1.5, ylim = c(-5, 5))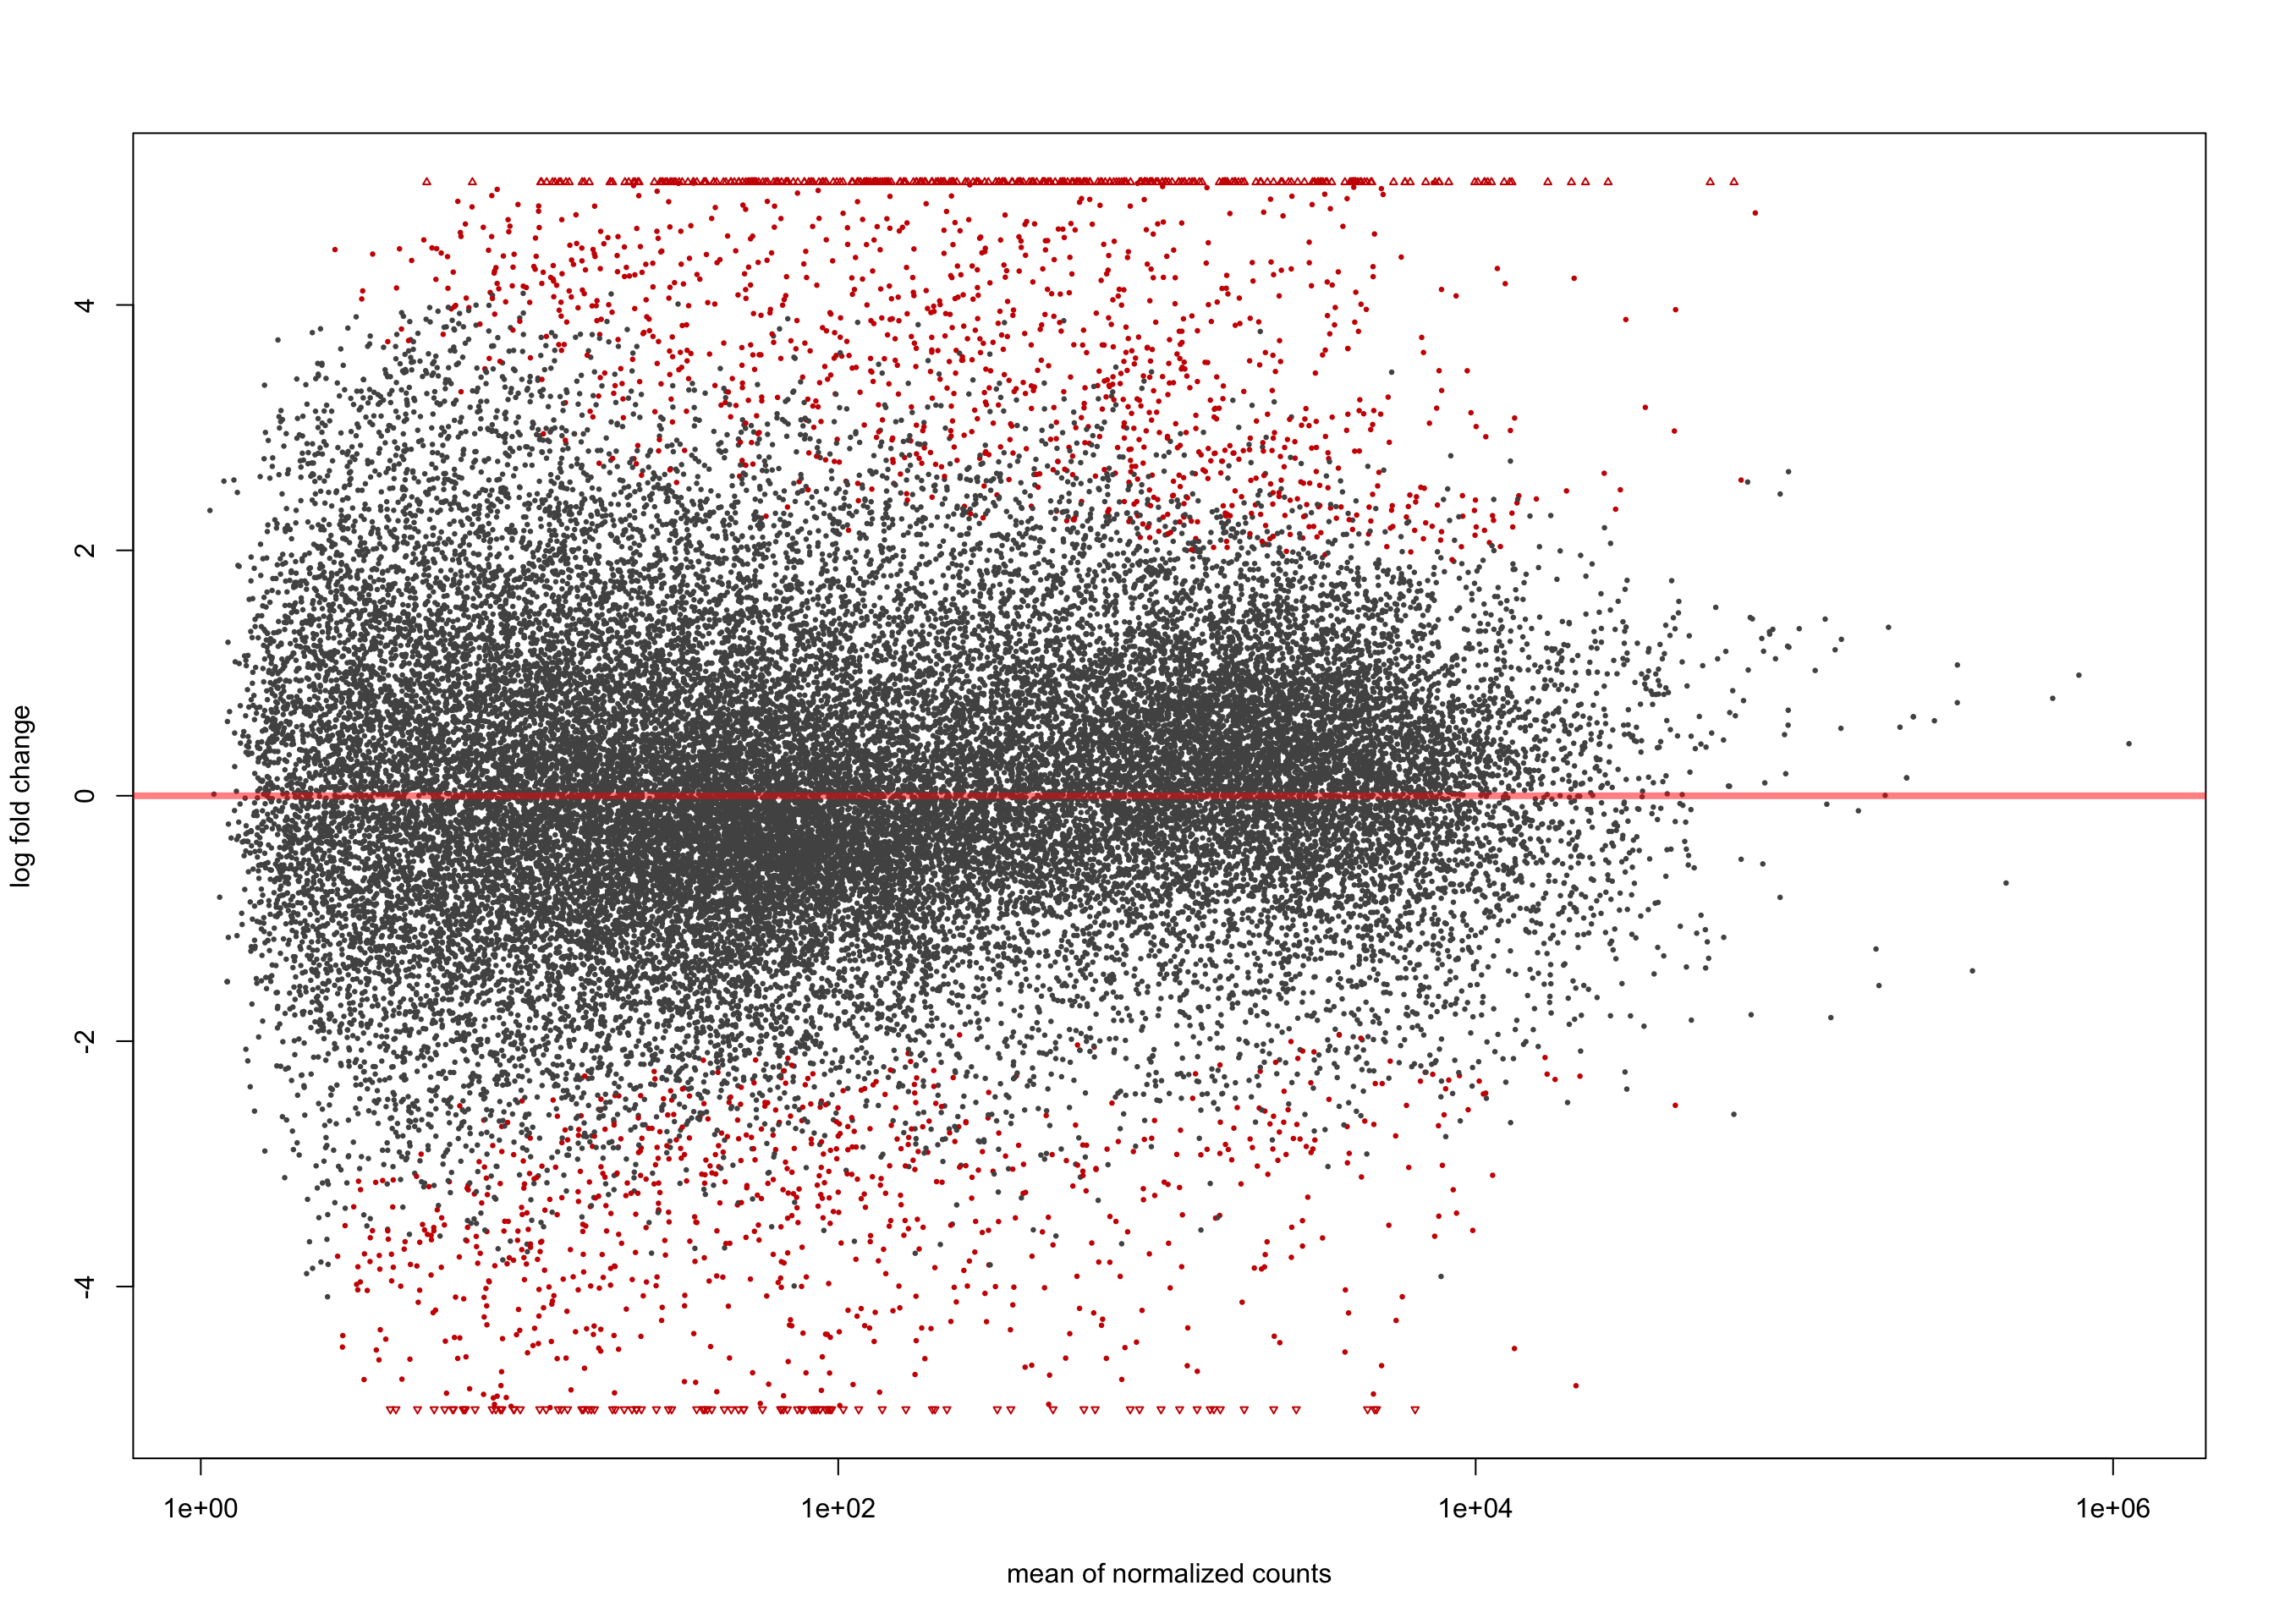
EBV-positive vs. EBV-negative
H0: LFC = 0
salmon$clean$de$ebv$lfc_0 <- results(
  salmon$clean$dds,
  contrast = list(c("ebv_statusPositive"),
                  c("ebv_statusNegative")))

summary(salmon$clean$de$ebv$lfc_0)
out of 36655 with nonzero total read count
adjusted p-value < 0.1
LFC > 0 (up)     : 2507, 6.8%
LFC < 0 (down)   : 2357, 6.4%
outliers [1]     : 0, 0%
low counts [2]   : 0, 0%
(mean count < 1)
[1] see 'cooksCutoff' argument of ?results
[2] see 'independentFiltering' argument of ?resultsplotMA(salmon$clean$de$ebv$lfc_0, ylim = c(-5, 5))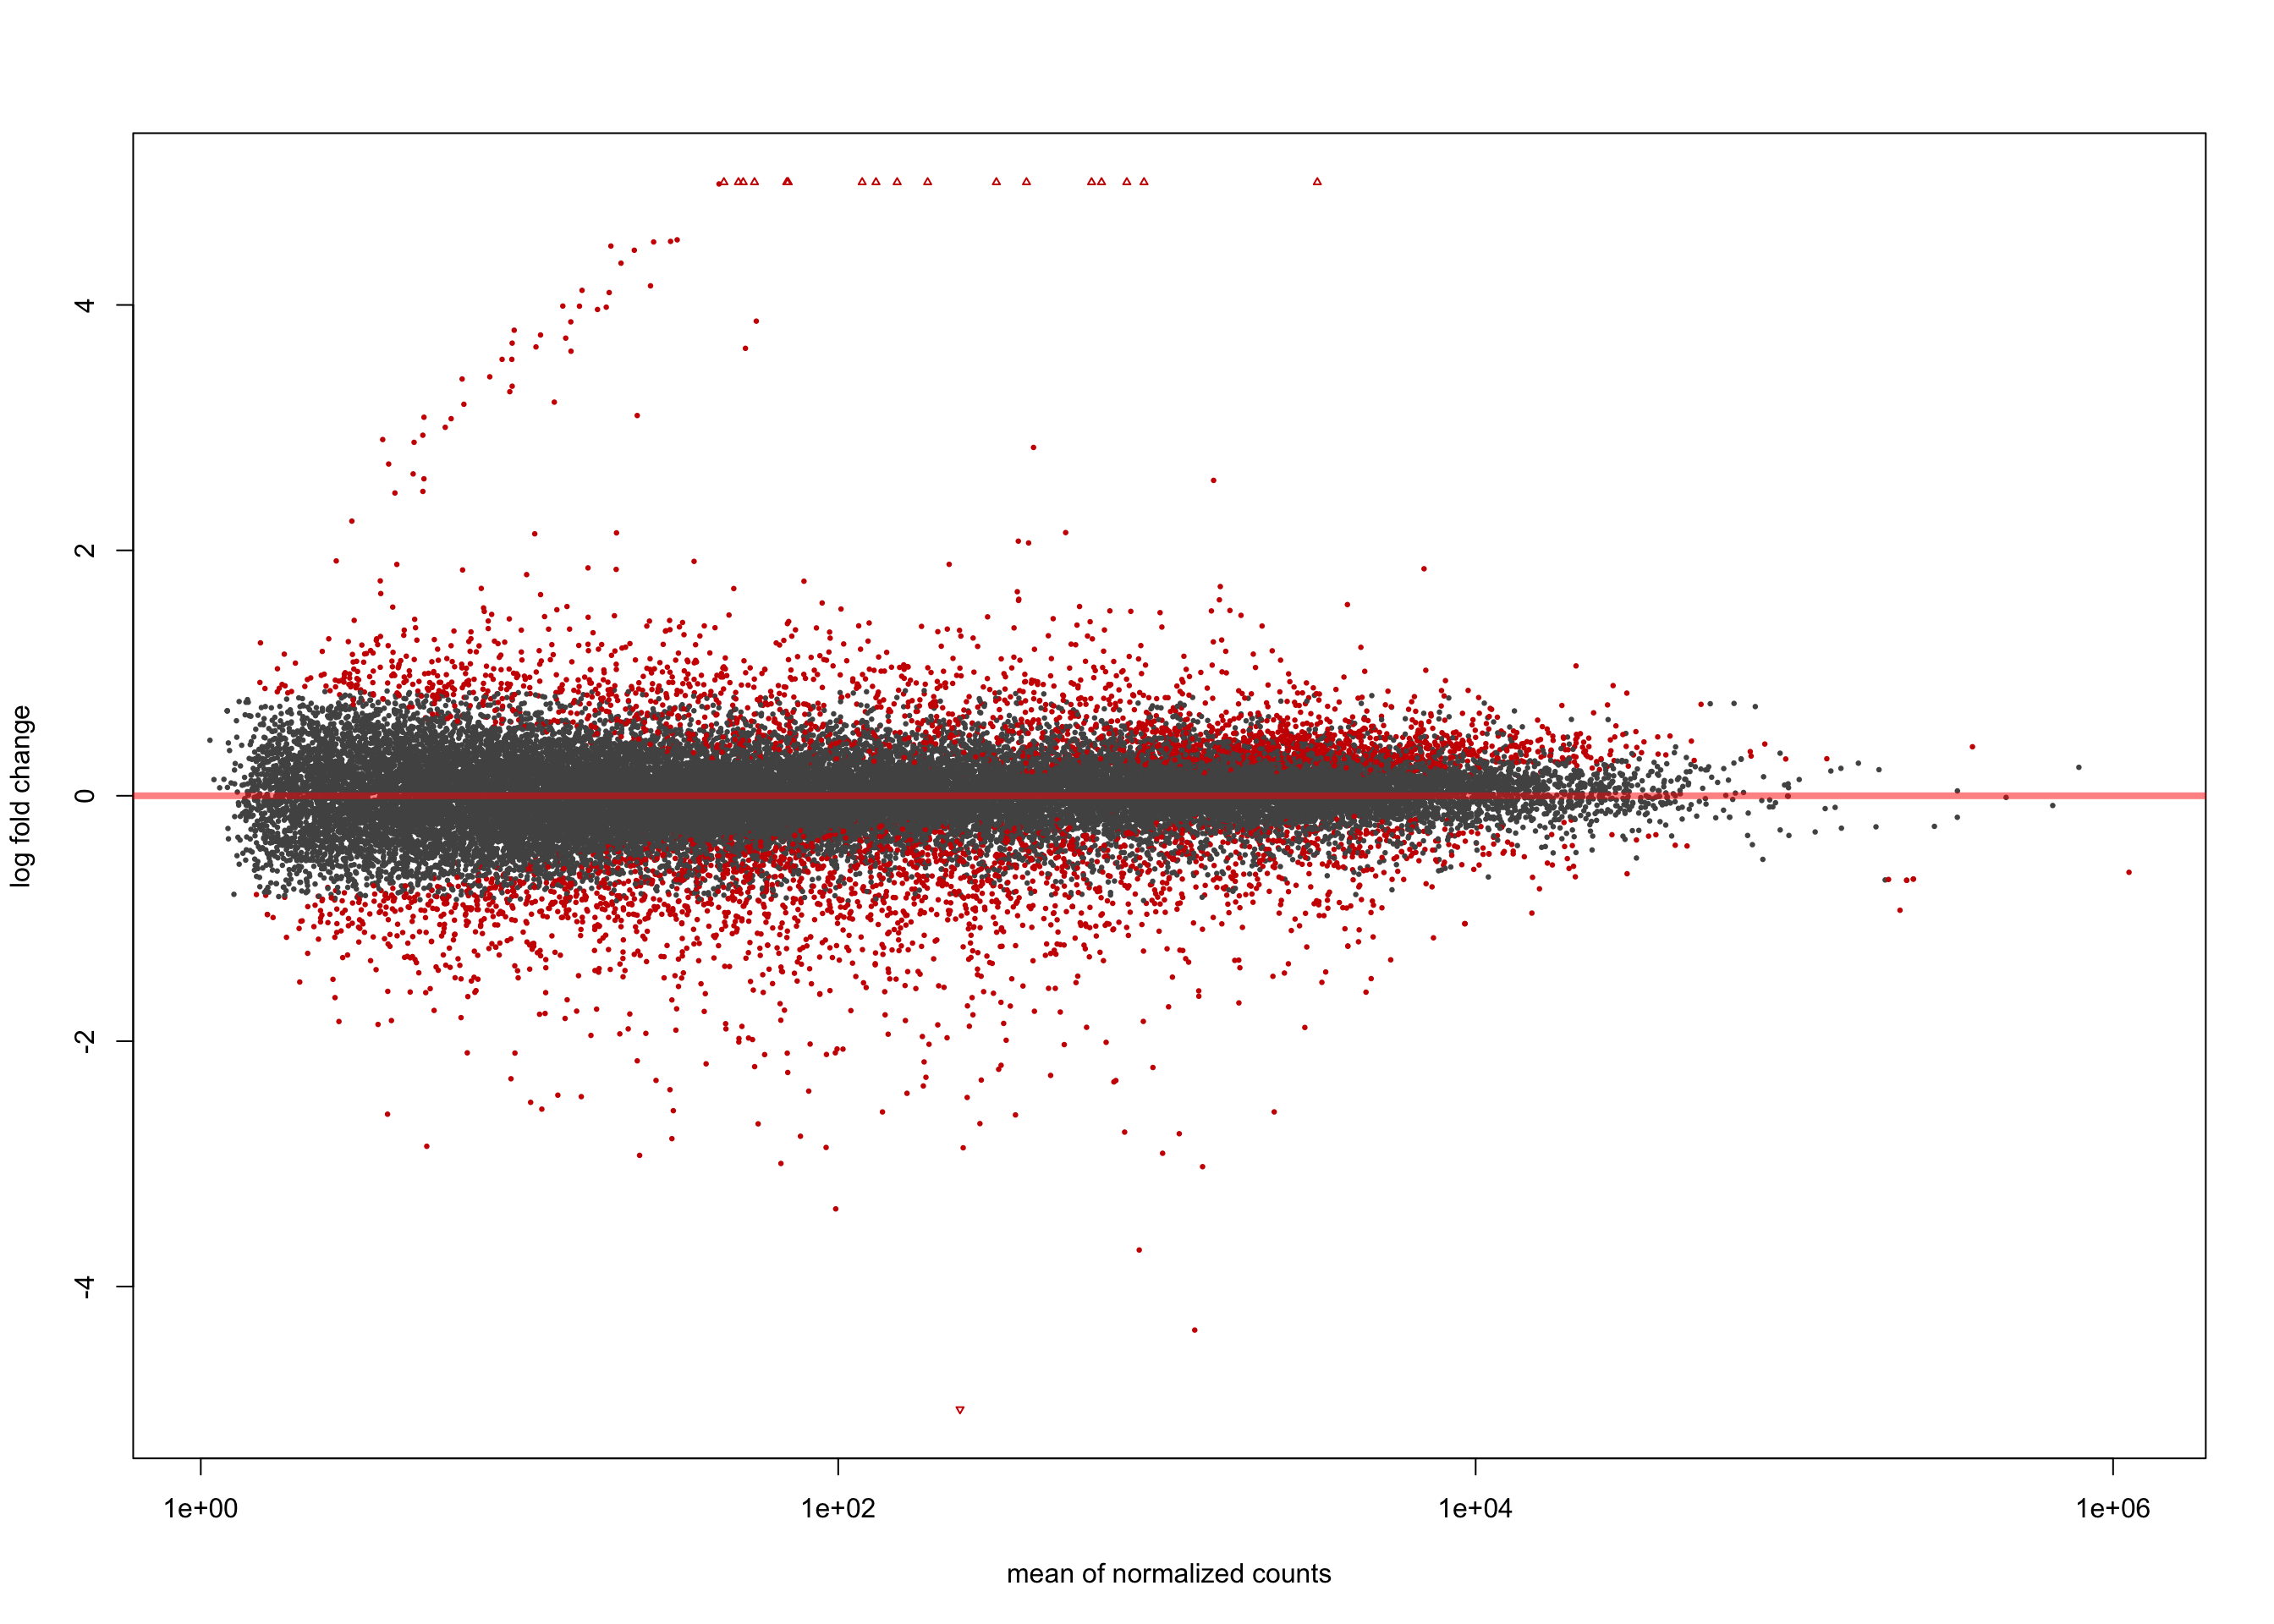
H0: |LFC| > 1.5
salmon$clean$de$ebv$lfc_1.5 <- results(
  salmon$clean$dds,
  contrast = list(c("ebv_statusPositive"),
                  c("ebv_statusNegative")),
  lfcThreshold = 1.5)

summary(salmon$clean$de$ebv$lfc_1.5)
out of 36655 with nonzero total read count
adjusted p-value < 0.1
LFC > 0 (up)     : 57, 0.16%
LFC < 0 (down)   : 18, 0.049%
outliers [1]     : 0, 0%
low counts [2]   : 0, 0%
(mean count < 1)
[1] see 'cooksCutoff' argument of ?results
[2] see 'independentFiltering' argument of ?resultsplotMA(salmon$clean$de$ebv$lfc_1.5, ylim = c(-5, 5))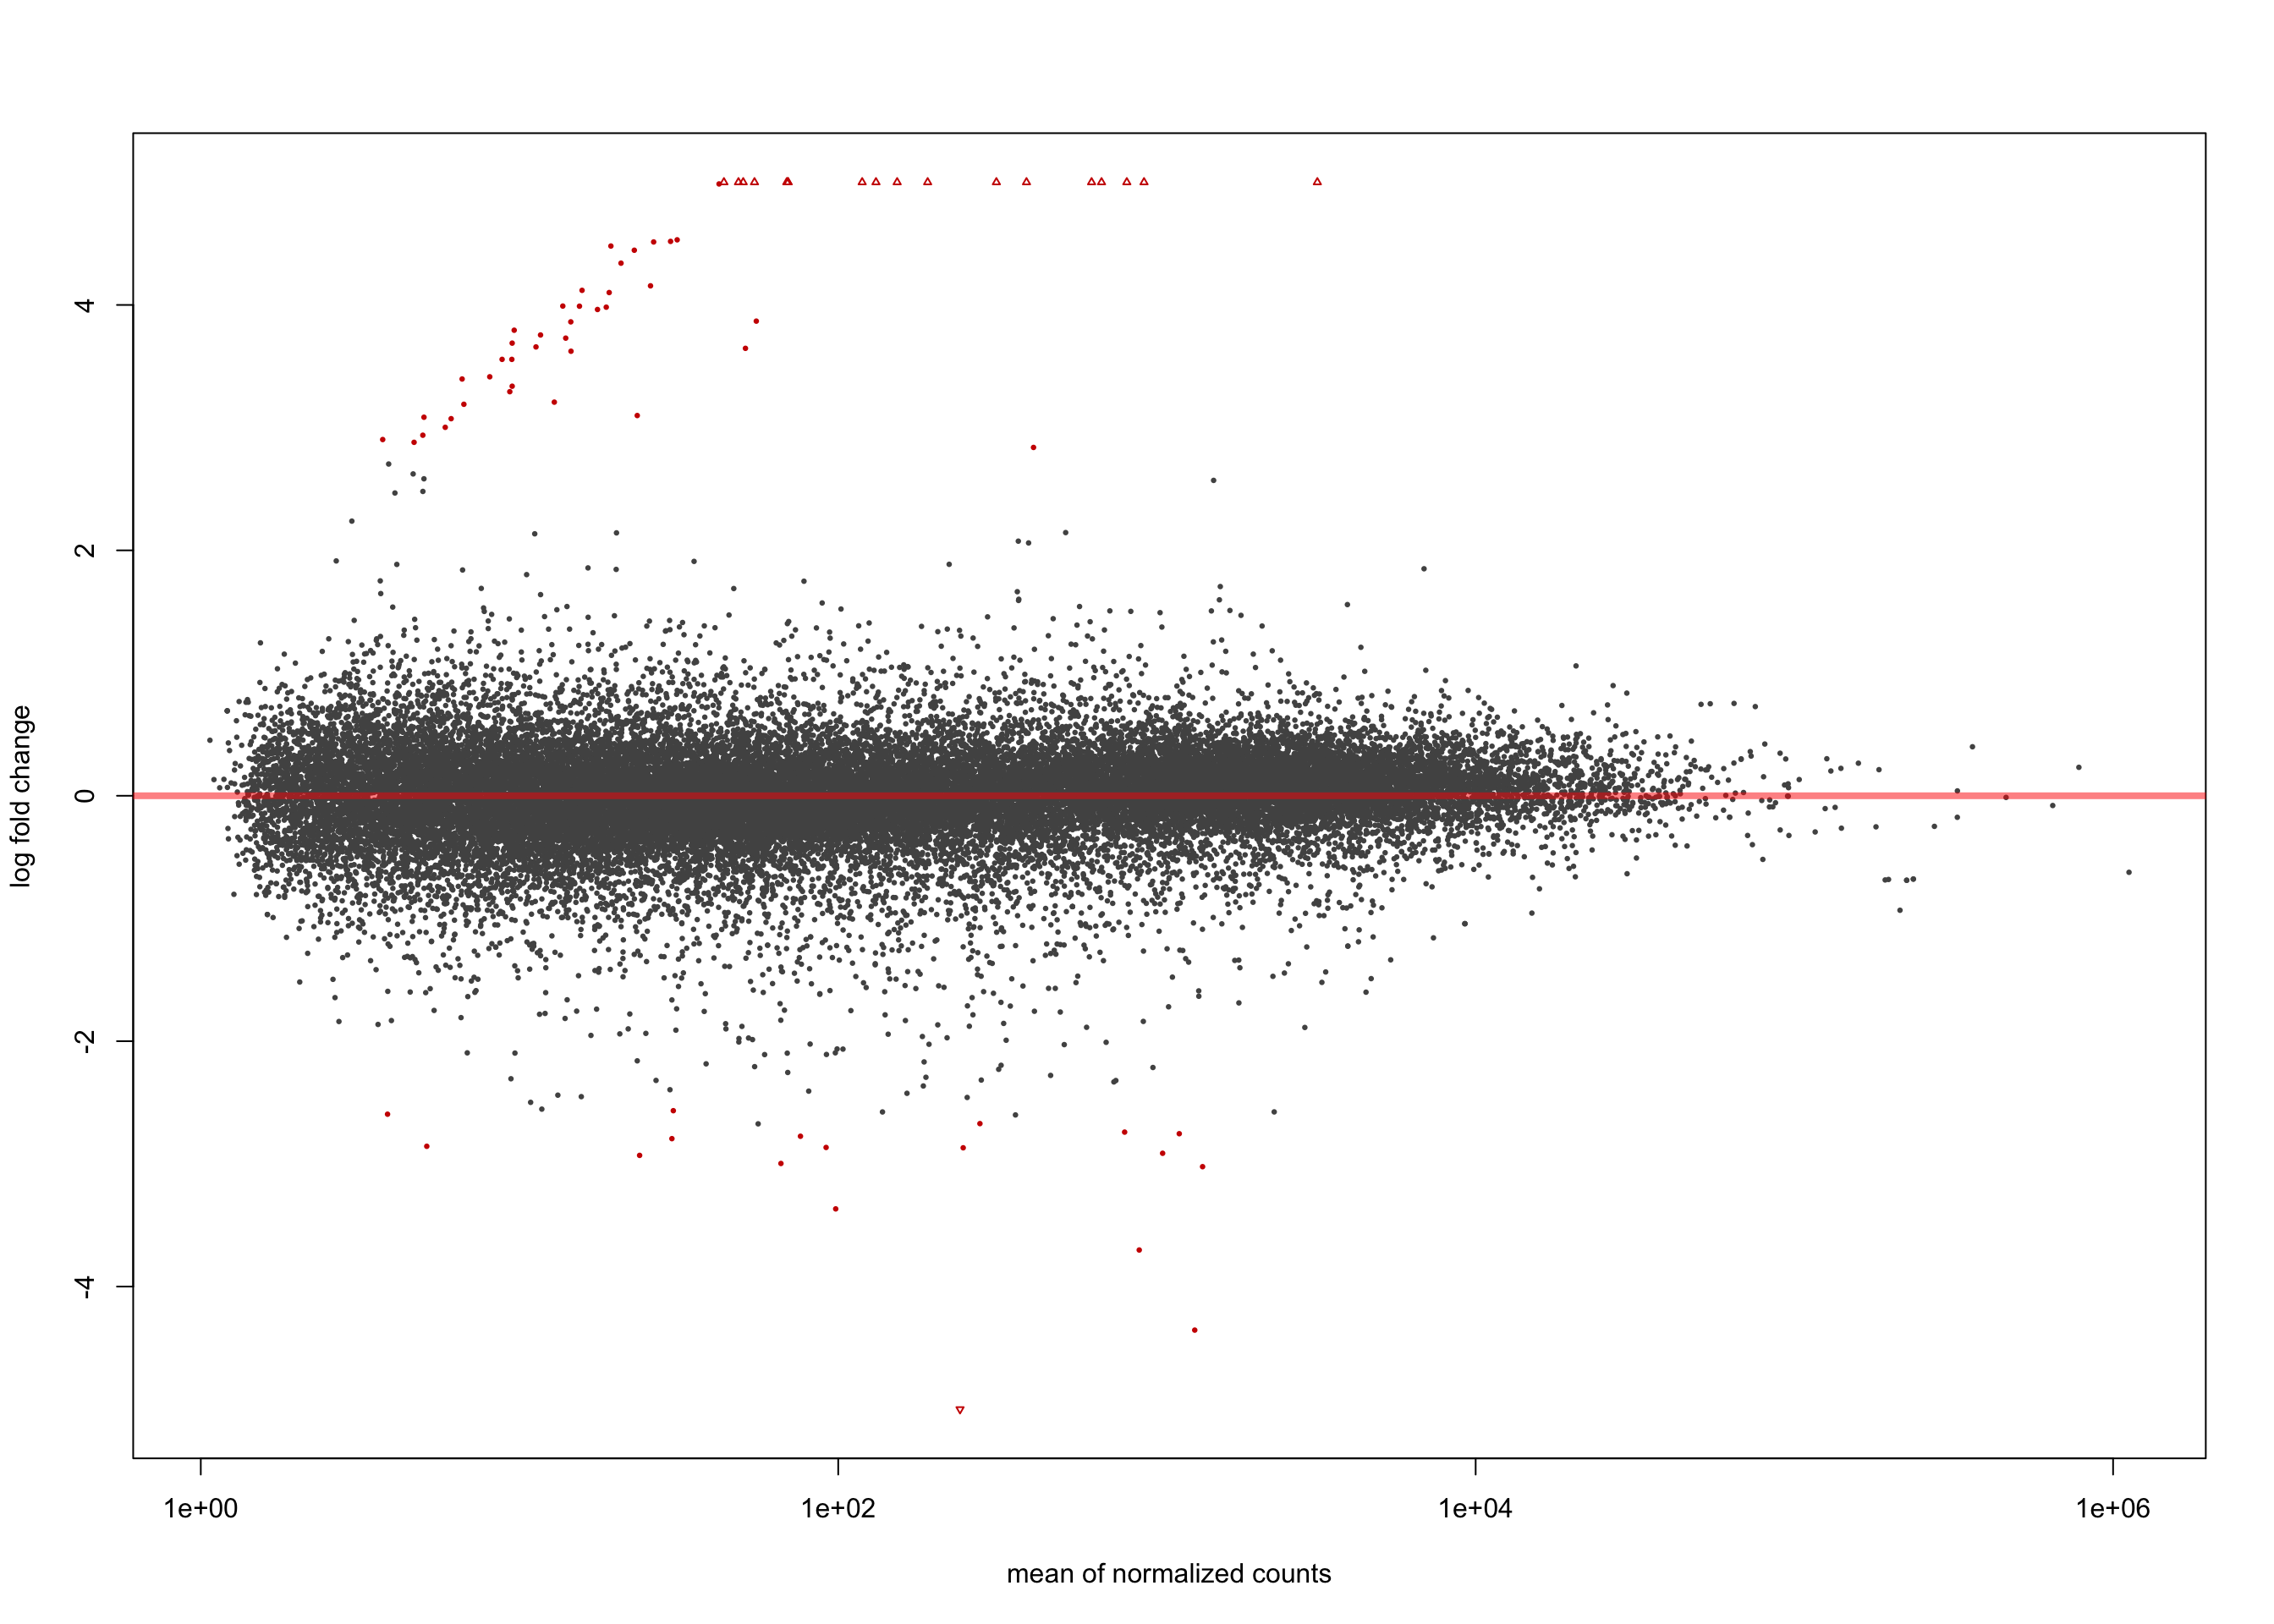
Endemic vs. Sporadic
H0: LFC = 0
salmon$clean$de$cv$lfc_0 <- results(
  salmon$clean$dds,
  contrast = list(c("clinical_variantEndemic"),
                  c("clinical_variantSporadic")))

summary(salmon$clean$de$cv$lfc_0)
out of 36655 with nonzero total read count
adjusted p-value < 0.1
LFC > 0 (up)     : 3589, 9.8%
LFC < 0 (down)   : 4027, 11%
outliers [1]     : 0, 0%
low counts [2]   : 0, 0%
(mean count < 1)
[1] see 'cooksCutoff' argument of ?results
[2] see 'independentFiltering' argument of ?resultsplotMA(salmon$clean$de$cv$lfc_0, ylim = c(-5, 5))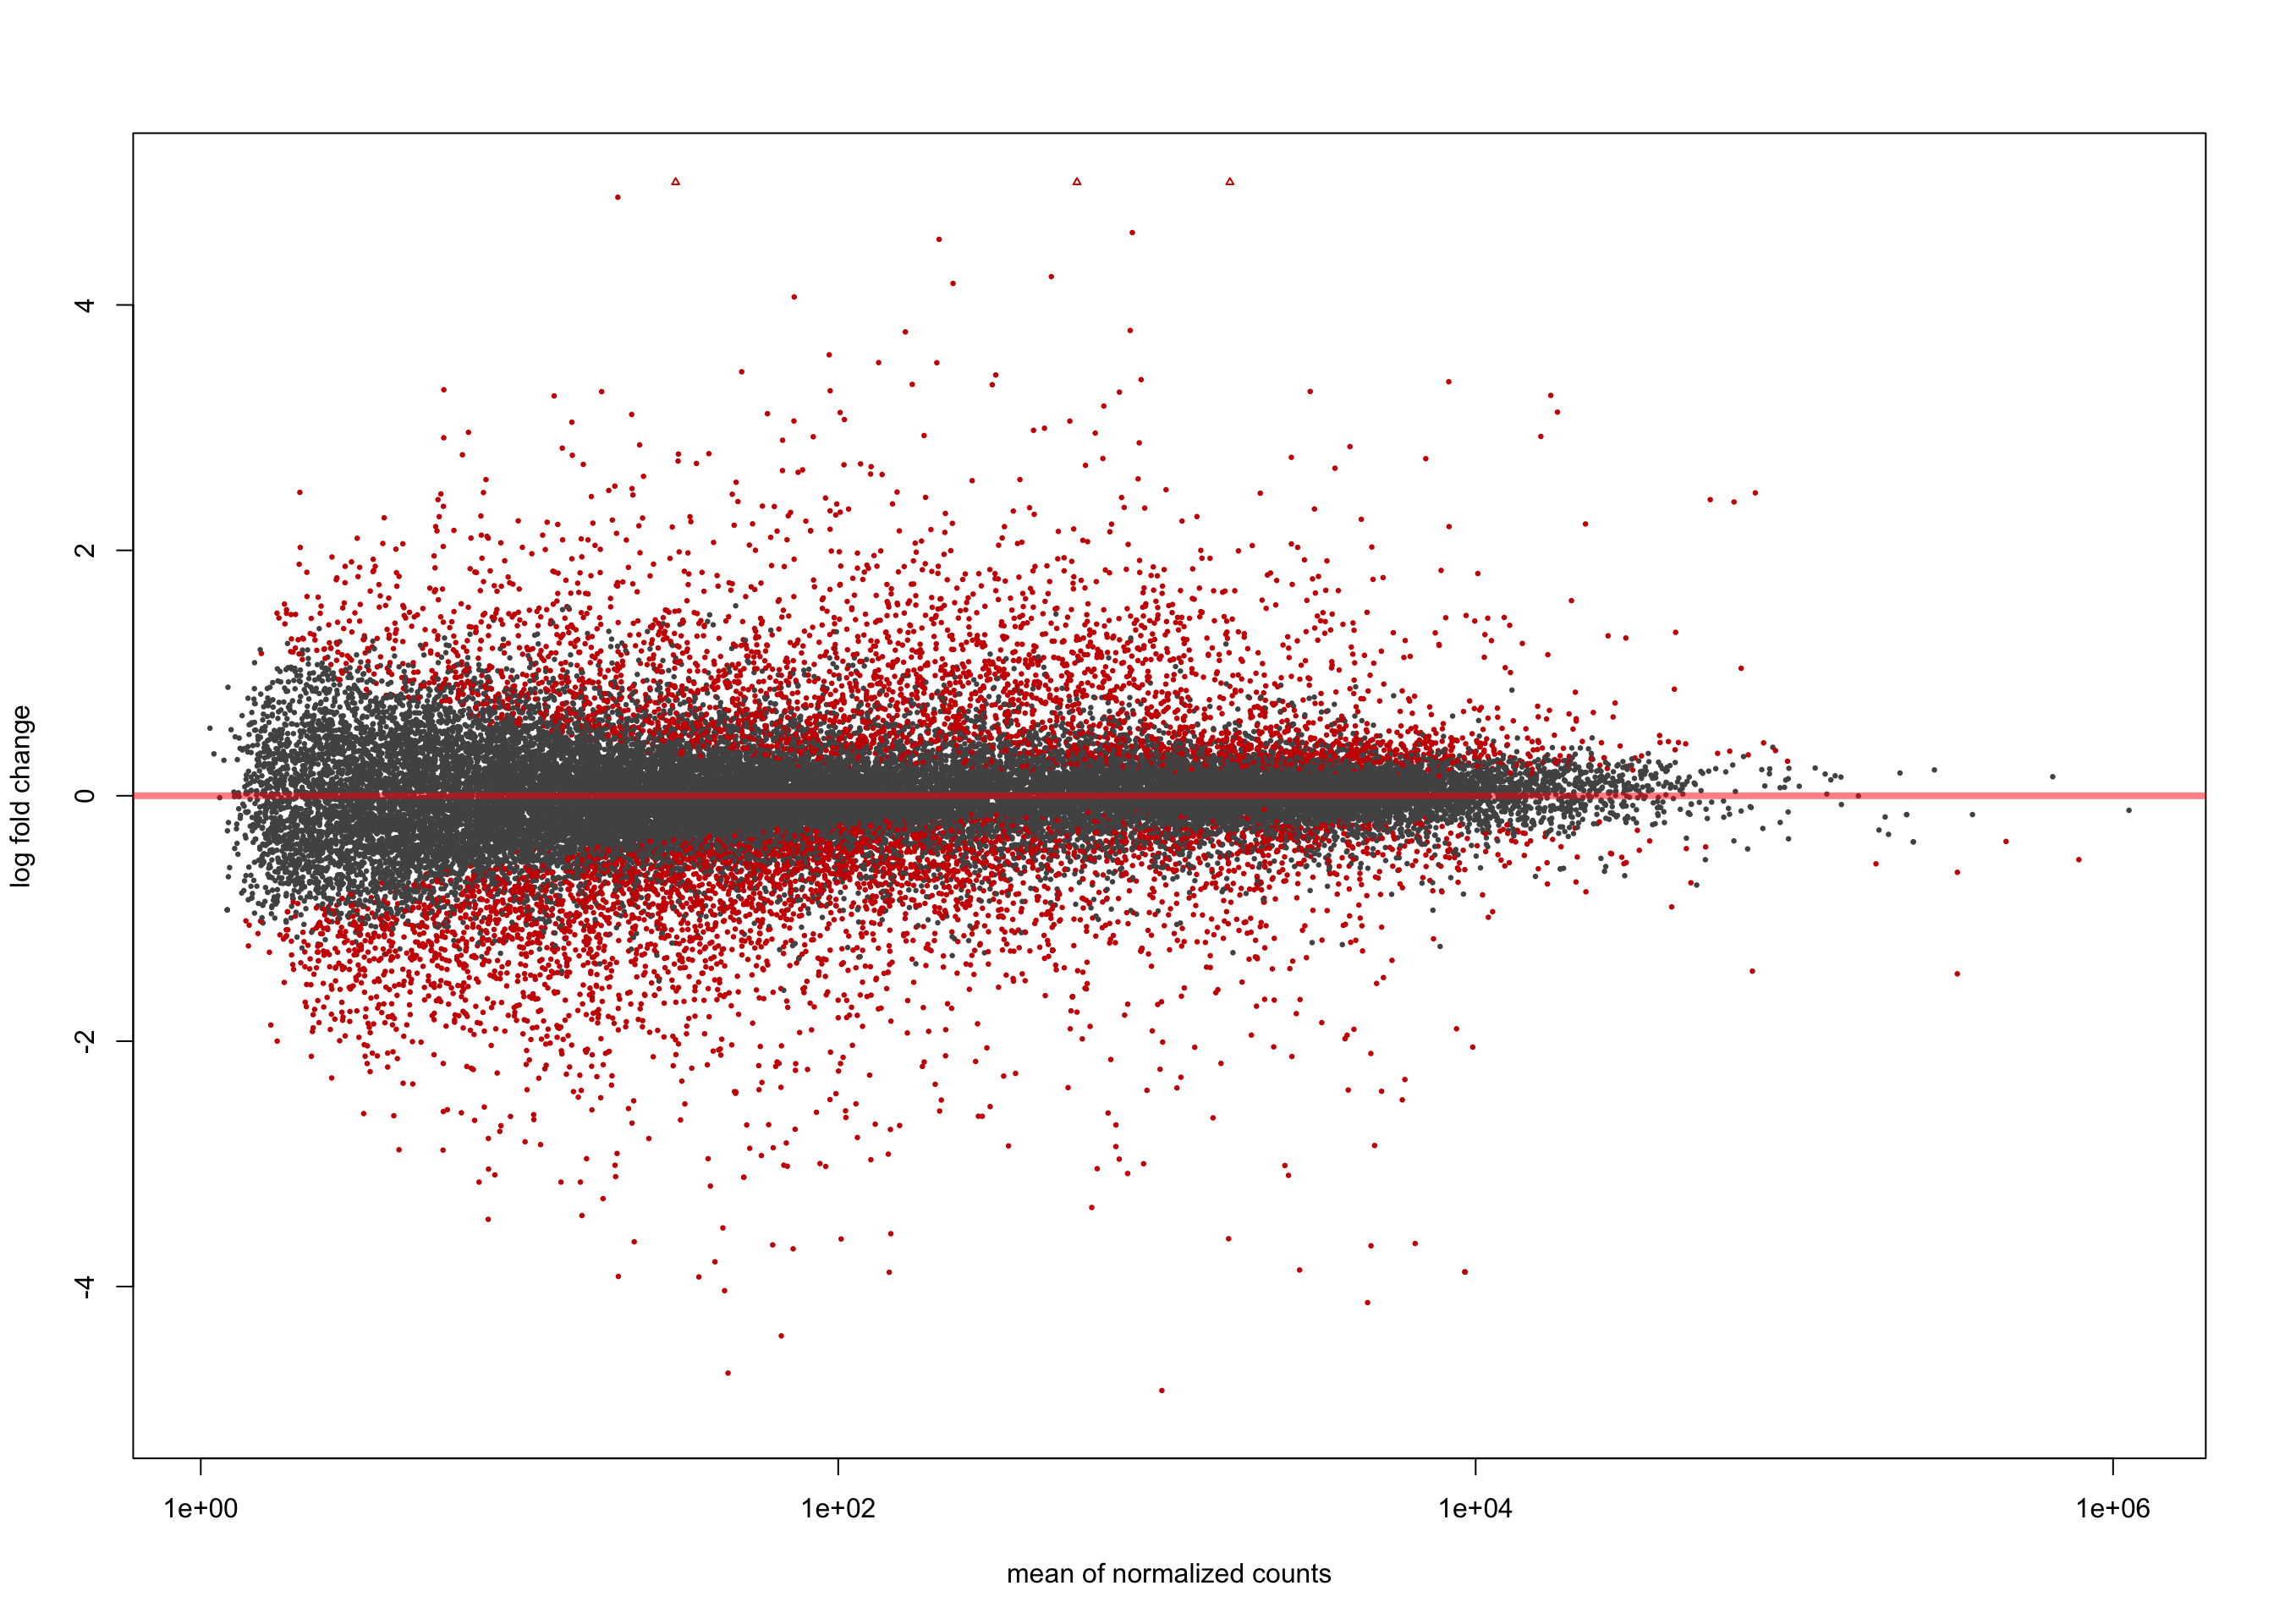
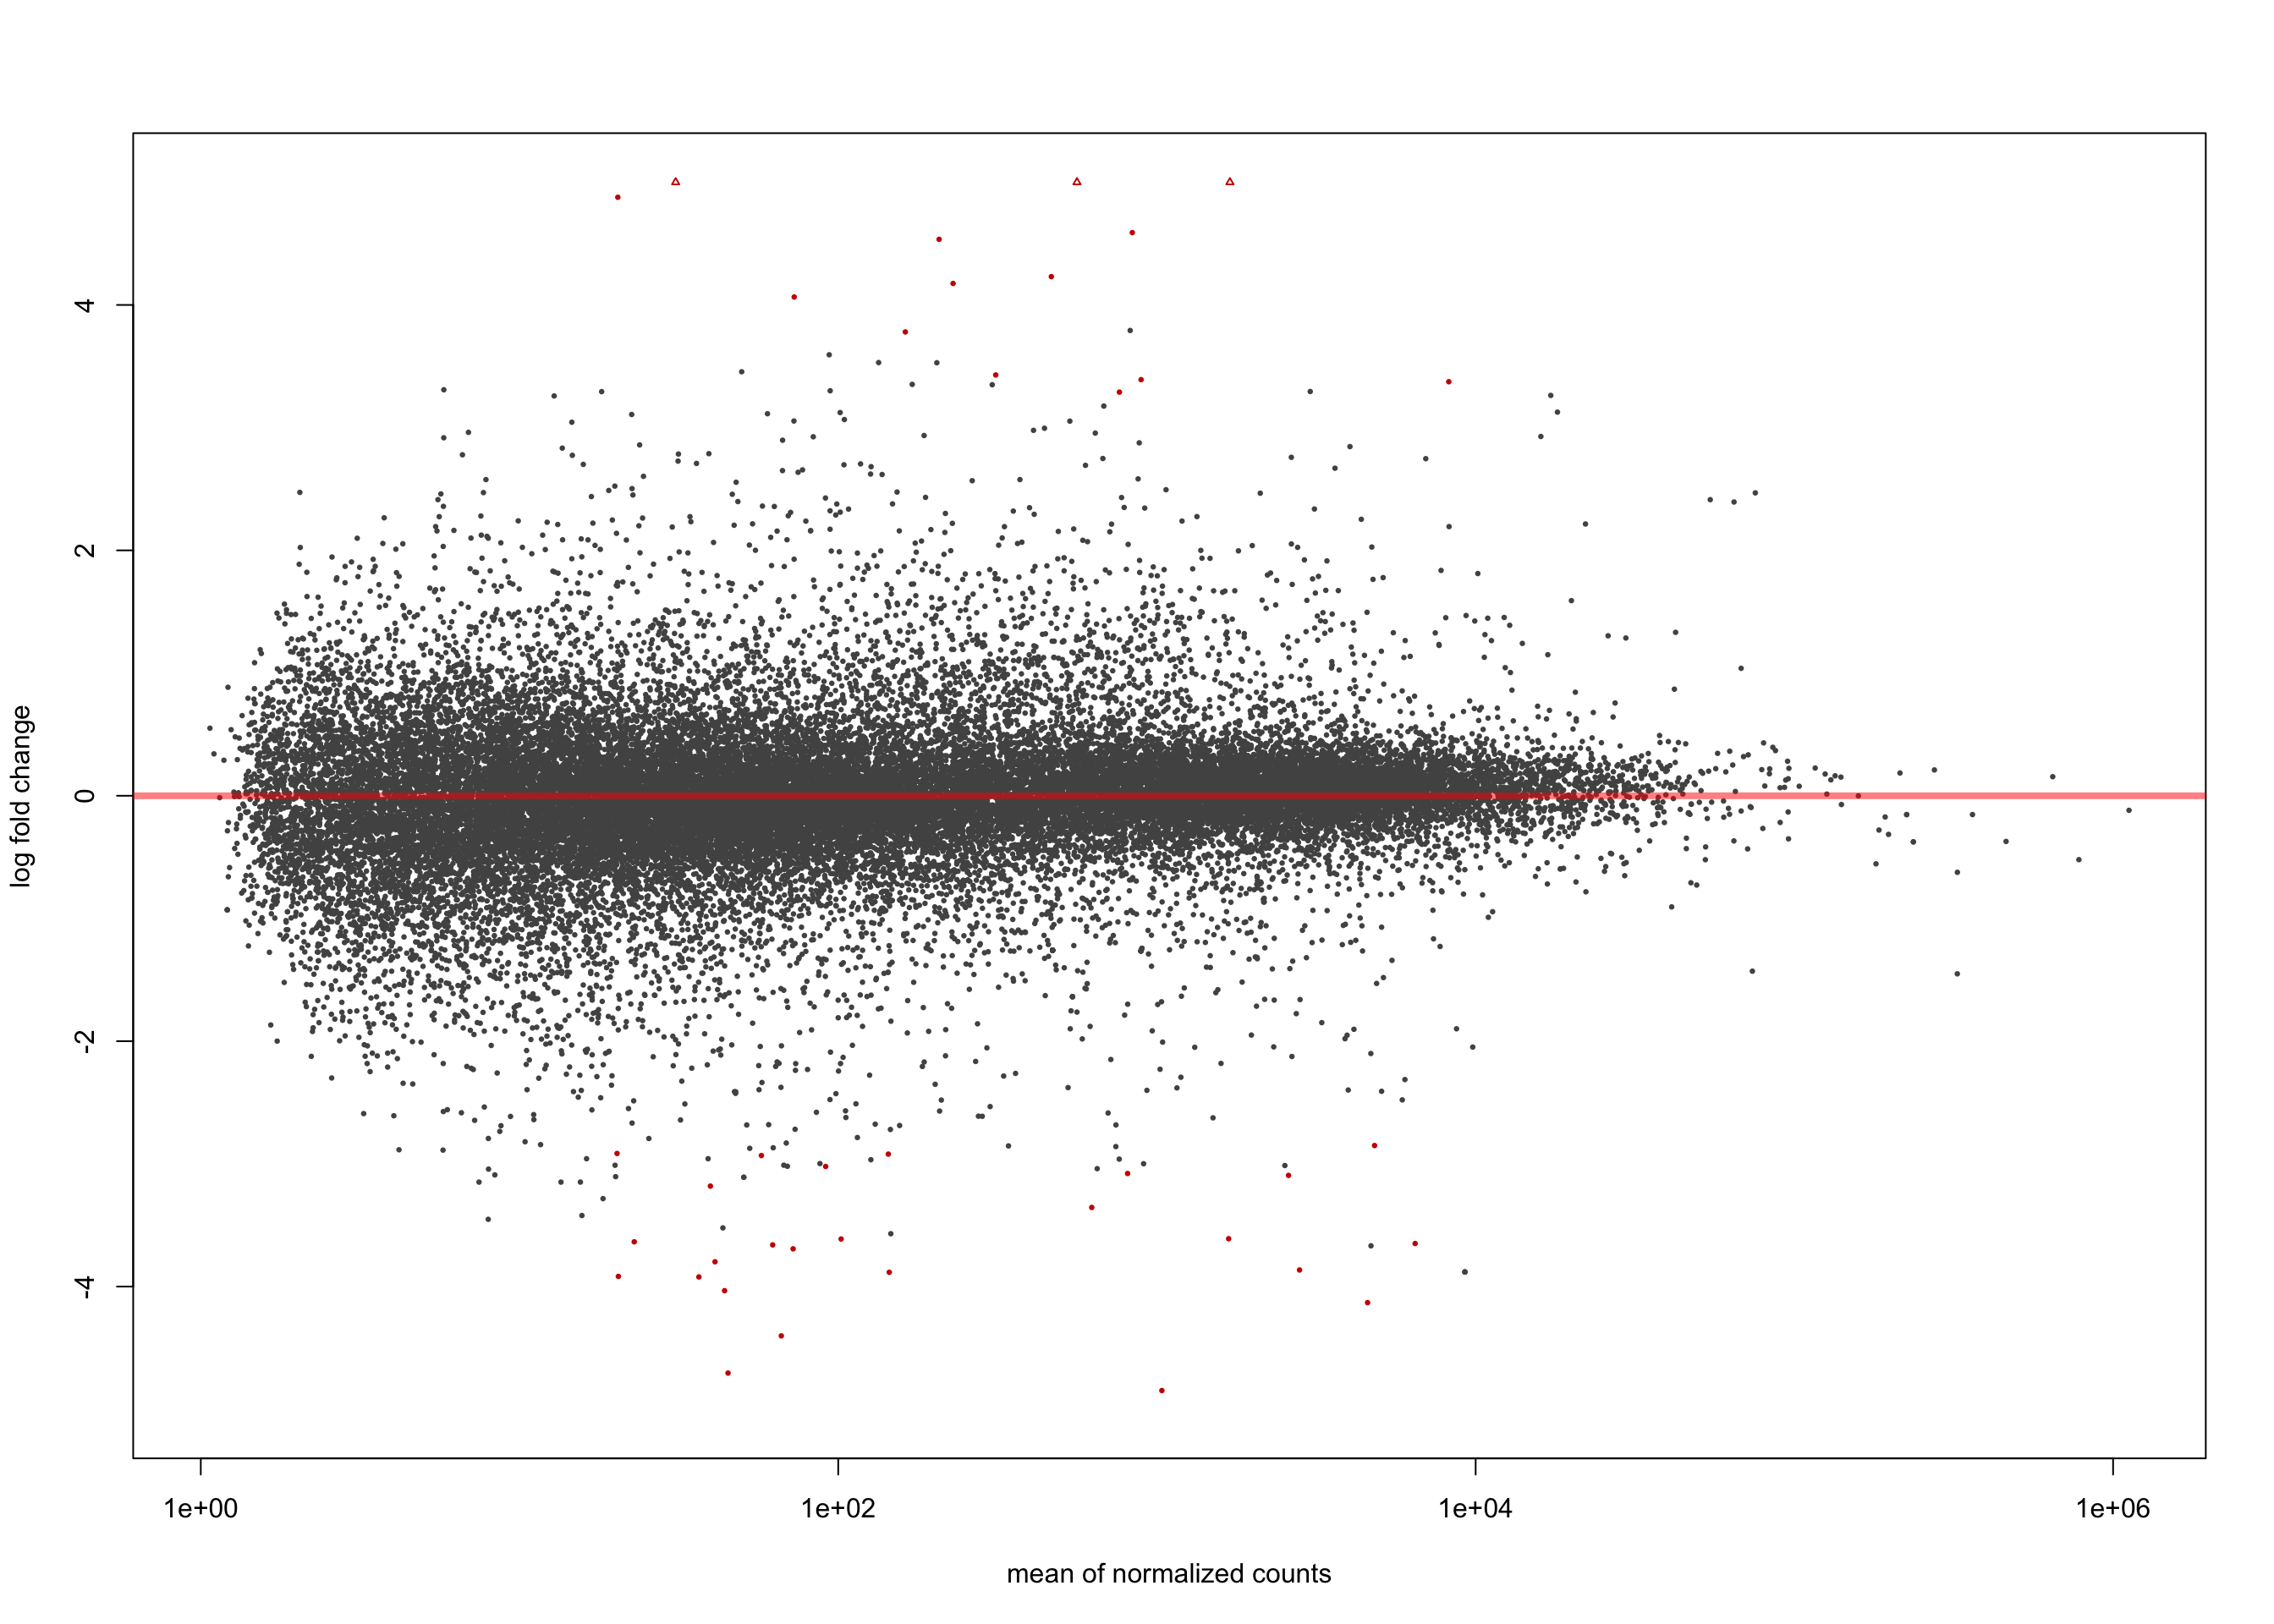
H0: |LFC| > 1.5
salmon$clean$de$cv$lfc_1.5 <- results(
  salmon$clean$dds,
  contrast = list(c("clinical_variantEndemic"),
                  c("clinical_variantSporadic")),
  lfcThreshold = 1.5)

summary(salmon$clean$de$cv$lfc_1.5)
out of 36655 with nonzero total read count
adjusted p-value < 0.1
LFC > 0 (up)     : 14, 0.038%
LFC < 0 (down)   : 25, 0.068%
outliers [1]     : 0, 0%
low counts [2]   : 3554, 9.7%
(mean count < 5)
[1] see 'cooksCutoff' argument of ?results
[2] see 'independentFiltering' argument of ?resultsplotMA(salmon$clean$de$cv$lfc_1.5, ylim = c(-5, 5))